
Where the Risk Is: Contract Risk Density Across Eleven Industries
Real estate contracts carry two-thirds more flagged risk per page than education contracts. A measured index of contractual risk density across eleven industries, from 2,320 contracts reviewed by AI.
Risk is near-universal. Its concentration is not.
Real estate contracts carry the highest density of flagged risk of any industry measured, at 2.67 red-flagged risks per hundred paragraphs, against an all-industry average of 1.67.
GenieAI Contract Risk Density Index 2026. n = 2,320 contracts, 1,245 organisations, February to July 2025.
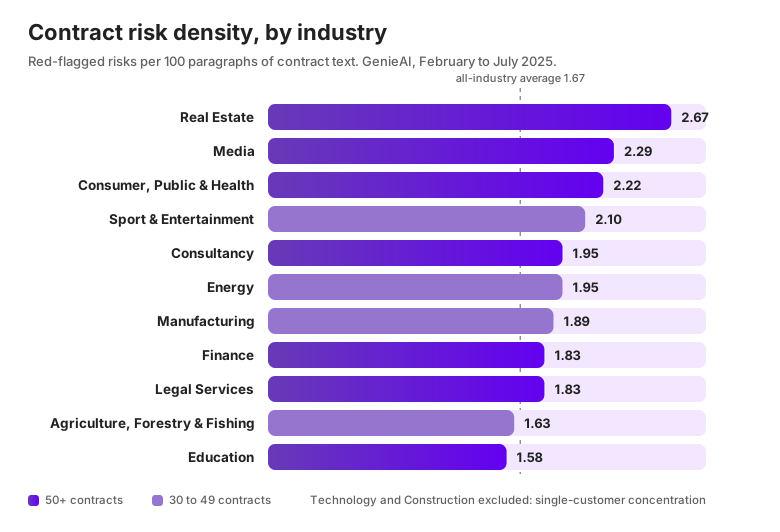
| Industry | Risks per 100 paragraphs | Contracts | Organisations | Tier |
|---|---|---|---|---|
| Real Estate | 2.67 | 64 | 58 | Headline |
| Media | 2.29 | 60 | 47 | Headline |
| Consumer, Public & Health Services | 2.22 | 77 | 58 | Headline |
| Sport & Entertainment | 2.10 | 32 | 27 | Supporting |
| Consultancy | 1.95 | 189 | 151 | Headline |
| Energy | 1.95 | 41 | 22 | Supporting |
| Manufacturing | 1.89 | 34 | 28 | Supporting |
| Finance | 1.83 | 71 | 56 | Headline |
| Legal Services | 1.83 | 195 | 160 | Headline |
| Agriculture, Forestry & Fishing | 1.63 | 45 | 40 | Supporting |
| Education | 1.58 | 75 | 59 | Headline |
| All industries | 1.67 | 2,320 | 1,245 | Baseline |
Counting problems rewards short documents.
Contracts belonging to legal services organisations have the highest ninetieth-percentile risk count of any industry measured, at 13 red flags, and are among the least risk-dense once contract length is taken into account.
GenieAI Contract Risk Density Index 2026. n = 195 contracts, 160 organisations.
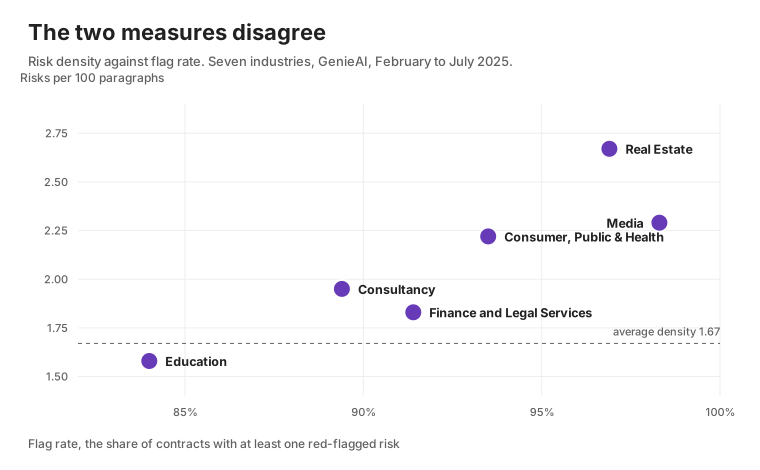
| Industry | Risk density | Density rank | Flag rate | Flag-rate rank |
|---|---|---|---|---|
| Real Estate | 2.67 | 1 | 96.9% | 2 |
| Media | 2.29 | 2 | 98.3% | 1 |
| Consumer, Public & Health Services | 2.22 | 3 | 93.5% | 3 |
| Consultancy | 1.95 | 4 | 89.4% | 6 |
| Finance | 1.83 | 5 | 91.5% | 4 |
| Legal Services | 1.83 | 5 | 91.3% | 5 |
| Education | 1.58 | 7 | 84.0% | 7 |
The excluded industries account for more contracts than the published ones.
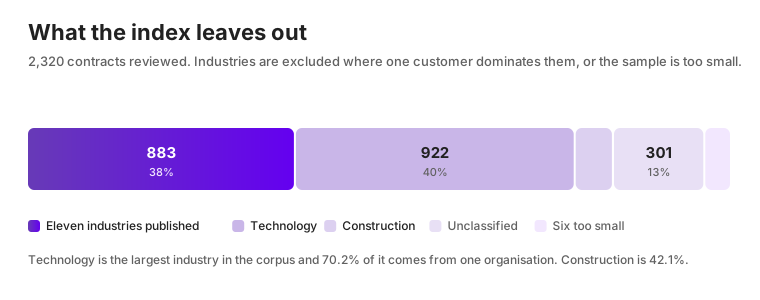
| Group | Contracts | Share | Reason |
|---|---|---|---|
| Eleven published industries | 883 | 38% | Published |
| Technology | 922 | 40% | One organisation supplies 70.2% |
| Unclassified | 301 | 13% | No single declared industry |
| Construction | 126 | 5% | One organisation supplies 42.1% |
| Six smaller industries | 88 | 4% | Fewer than 30 contracts each |
Contracts are reworked narrowly, not deeply.
Of contracts that were negotiated at all, 72% were marked up in exactly one clause, and the median contract had one clause reworked.
GenieAI Contract Risk Density Index 2026. n = 10,682 contracts, 9,520 organisations.
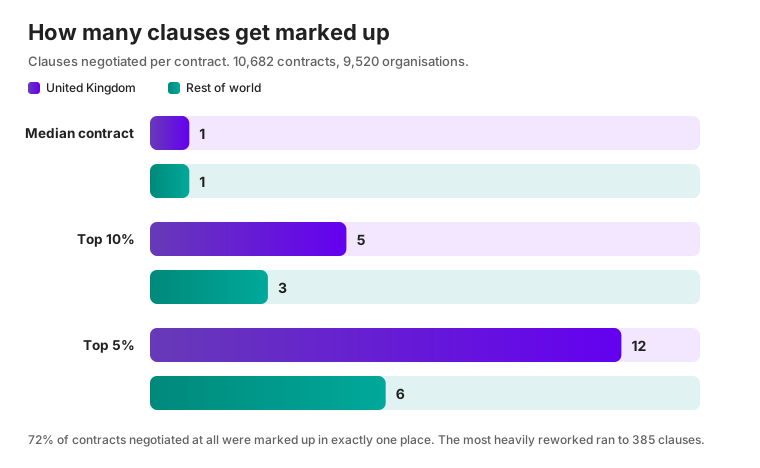
| Measure | Global | United Kingdom | Rest of world |
|---|---|---|---|
| Median clauses marked up | 1 | 1 | 1 |
| 90th percentile | 4 | 5 | 3 |
| 95th percentile | 7 | 12 | 6 |
| 99th percentile | 63 | 103 | 40 |
| Most in a single contract | 385 | 294 | 385 |
| Marked up in exactly one place | 72.1% | 62.9% | - |
| More than 60 clauses marked up | 1.06% | 1.69% | 0.80% |
About this data
Figures are aggregated, anonymised telemetry from contracts reviewed on the GenieAI platform. No contract text, personal data or customer-identifiable information is included. A risk is a red-flagged finding; an issue is a red or amber finding. Density is red-flagged risks per hundred paragraphs of contract text. Industry is self-declared by the organisation at signup from a fixed list, and figures count only organisations that declared a single industry. Review times are flat across every industry, between 22 and 29 seconds at the median, so they are not reported per industry. Chapter four draws on a separate population of contracts with clause-level negotiation activity, which overlaps the review corpus by 11%.
| Sample | 2,320 contracts from 1,245 organisations for the index. 10,682 contracts from 9,520 organisations for the negotiation chapter. GenieAI has handled 381,109 contracts from 247,303 organisations since June 2020, of which 2.6% have ever had a risk review. |
| Period | 19 February to 31 July 2025. |
| Data as at | September 2026 |
- No industry is reported below 50 contracts, or fewer than 5 organisations, or where a single organisation accounts for more than a third of the contracts. Four industries are reported at a lower threshold of 30 contracts and are marked as supporting.
- Review records before 19 February 2025 were removed under data retention and no longer exist.
- From August 2025, findings stopped being linked to a specific paragraph of the source document, so risks per hundred paragraphs cannot be computed after that date. This index is a fixed study of a closed period rather than a running tracker.
- Only 2.6% of contracts on the platform have ever had a risk review, so this is a selected population and not a sample of all contracts.
- All figures were read from a single database snapshot on 3 September 2026.
Use these figures
You’re welcome to reproduce these statistics and charts with attribution and a link to this page.
GenieAI (2026). Contract Risk Density Index. https://www.genieai.co/research/contract-risk-density-index-2026